
Gamified location assessment experience for Studenac
01 OVERVIEW
A conference game that turns Studenac’s location assessment tool into an engaging “human vs AI” challenge.
Studenac, one of Croatia’s leading retail chains, developed an internal Location Assessment Tool (LAT) to evaluate potential store locations across the country. For a series of conferences, they wanted a playful way to showcase this tool at their booth.
Our task was to create a short, memorable game that introduces LAT through a fun “human vs AI” moment, something anyone could understand and enjoy within just a few minutes.
02 BRIEF
The challenge
- Turn a complex, data‑heavy tool into a 2-3 minute game anyone can understand.
- Make it feel like a “human vs AI” battle, even though the logic is a sophisticated algorithm, not true AI.
- Design fair scoring so players can do well even if they do not pick classic tourist hotspots.
03 approach
Understanding users and constraints
We approached the problem from two sides:
- Client’s perspective, where the tool represents expertise and internal knowledge.
- The conference visitor’s perspective, where time and attention are limited.
The booth setup added additional constraints:
- Players would interact with a TV screen from a distance.
- Internet connectivity could vary.
- The experience needed to be easy for booth staff to operate during a busy event.
With these conditions in mind, we shaped an interface that prioritized clarity: large, readable UI elements, straightforward calls to action and a flow that takes a visitor from “What’s this?” to playing the game in just a few clicks.
04 GAME
Competitive with honest data
Working with the Studenac team, we explored ways to make LAT feel like a real opponent rather than a hidden calculation engine. We iterated through several directions before aligning on “I vs AI”, which communicates the concept clearly without overpromising.
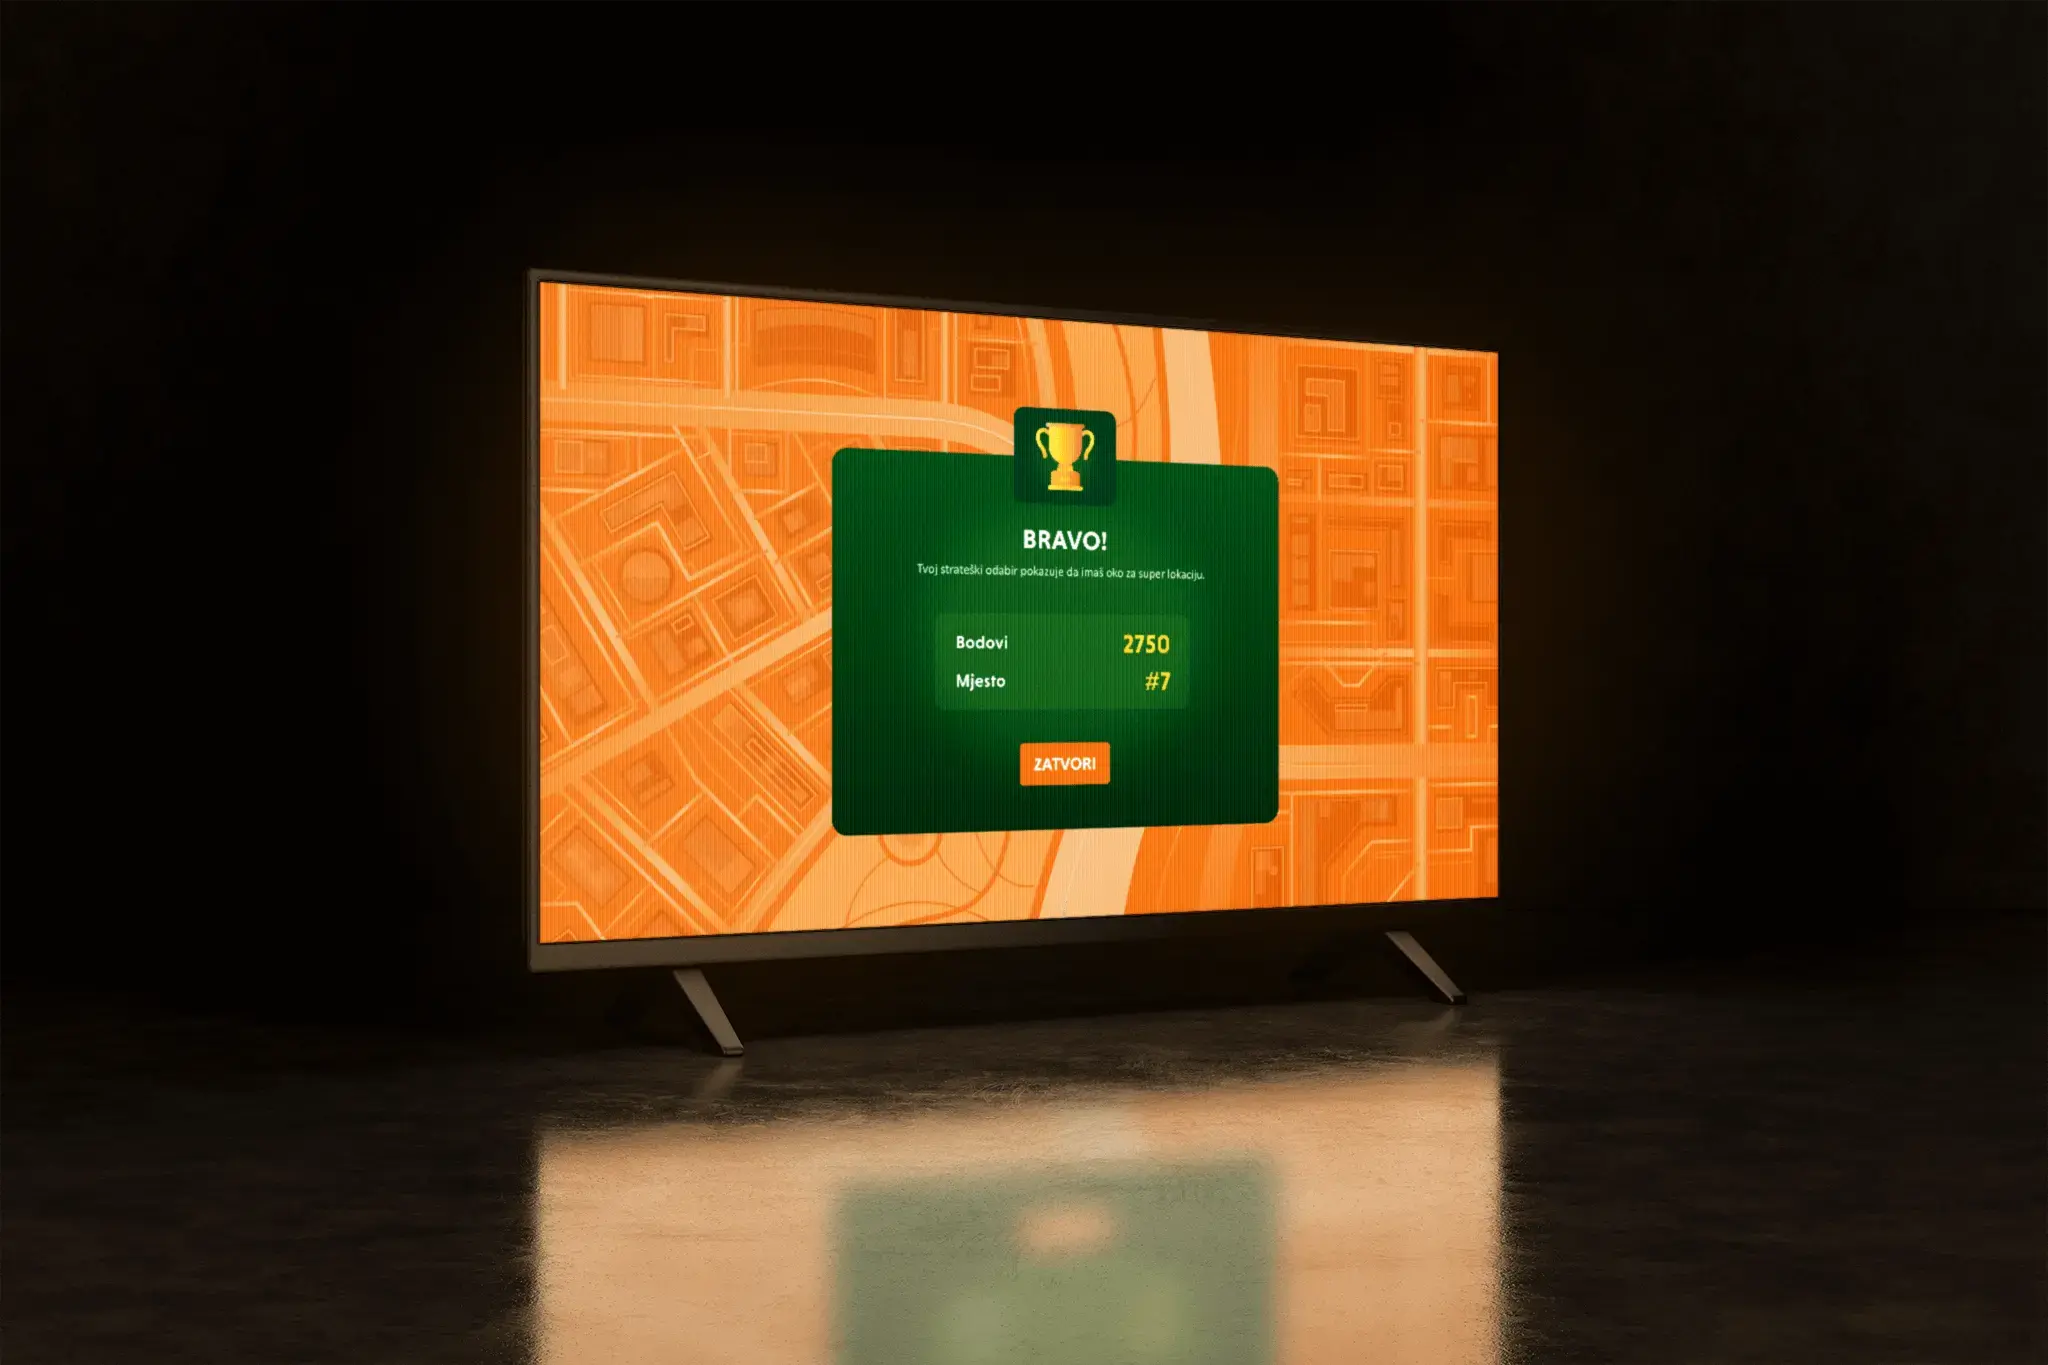
Players chose a location where they would open a new Studenac store. The game then compared their intuition with LAT’s evaluation.
To keep the experience fair and enjoyable, we developed a scoring model that rewards both top national locations and strong picks within a specific city or municipality. This way, players could score well even if they weren’t selecting tourist hotspots, while the underlying data remained authentic.
05 ux&ui
Focus on clarity
We developed a web app with a lightweight custom backend, designed specifically for conference-booth conditions. The interface needed to strike the right balance: informative like a map-based tool, but approachable and playful enough to function as a game. Think less “static dashboard” and more “GeoGuessr-style interaction”.
Our focus was clarity.
We used intuitive filters, clear labels and short instructions to help players understand the rules quickly and complete a round within minutes.
All complex calculations and parameters stayed in the background. The player saw a simple interaction and a clear outcome, while the robust logic worked quietly underneath.
GOALS
- Attract conference visitors to the Studenac booth and encourage them to try the game.
- Clearly demonstrate how Studenac’s Location Assessment Tool helps decide where to open new stores.
- Make the complex tool feel simple and fun, so that anyone can understand it in a few minutes.
RESULTS
- The game ran across two days at the conference with 0 problems in over 150 rounds.
- The booth attracted steady traffic and the game gave Studenac a tangible way to talk about how they decide where to open new stores.
- The client was very satisfied with the engagement and with how their internal tool was translated into something accessible, memorable and fun.
PROJECT TEAM
STUDENAC
- Project Lead – Nina Mimica
- Data Science Director – Marin Grgurev
- Senior Data Scientist – Ivan Glavinić
ENTERWELL
- Product Lead – Matej Bošnjak
- Project Manager and Development Lead – Matej Radović
- UX/UI Design Lead – Romana Miler
- Copywriter – Lorena Ouahchia
Looking for a partner?
Outline your project, no need to go into much detail.
We will do the rest of the work and send you an obligation-free quote.